
Most large companies don’t suffer from a lack of data.
They suffer because the data arrives too late, sits in separate systems, or gets turned into forecasts that only describe one small part of the business.
A plant manager may see vibration data. Supply-chain teams see demand. Finance sees inventory and energy costs. Each group has a dashboard. Each group has a forecast. Yet the factory still gets surprised by a machine failure, a shortage, or a late customer order.
Banks have the same problem in a different suit. Treasury sees cash flows. Risk sees delinquency. Operations sees payment volumes. Branch teams see ATM demand. The signals connect, but the forecasts often don’t.
That is why Google’s new TimesFM-3 model matters.
TimesFM-3 is a forecasting model built to look at many related time series at once, along with information already known about the future: planned promotions, holidays, weather, production schedules, rate resets, and more. Google says it can produce point forecasts and a range of likely outcomes without task-specific fine-tuning.
In plain English: it gives a business a better chance to see what is coming before the cost hits the P&L.
The shift: from isolated forecasts to connected decisions
Traditional forecasting often treats one metric as its own island.
Forecast sales from past sales.
Forecast machine temperature from past temperature.
Forecast ATM withdrawals from past withdrawals.
That works until the world changes. A production schedule changes. A maintenance window moves. A supplier misses a delivery. A public holiday shifts transaction volumes. An interest-rate reset changes customer behavior….
TimesFM-3 is designed for this messier, more useful reality. It can learn from the history of several connected signals and use future-known signals when it makes a forecast. It also produces uncertainty bands, not just a single number. That matters. Decision markers do not need false certainty; they need to know the likely range, the downside case, and the decision they should make now.
The value proposition is simple:
See risks and opportunities earlier, then move money, inventory, people, and capacity before the business absorbs the shock.
Manufacturing: predict the event, not just the metric
Consider a global manufacturer with 12 plants and a mix of CNC machines, furnaces, conveyors, and packaging lines.
A line failure can stop production for hours. The direct cost may be painful. The wider cost is worse: late orders, overtime, expedited freight, missed service levels, and frustrated customers.
A conventional model might forecast bearing vibration using only past vibration readings. Useful, but incomplete.
A multivariate forecast can combine:
-
Vibration, temperature, pressure, and power-draw history
-
Machine cycle times and reject rates
-
Operator shifts and planned production runs
-
Scheduled maintenance
-
Outside temperature where it affects cooling systems
-
The future production plan for the line
Now the forecast has context.
If the system sees a rising temperature pattern, abnormal power draw, a heavier production run planned for tomorrow, and a maintenance slot not scheduled for another week, it can flag a higher-risk window before the line fails.
That does not mean the model “knows” a bearing will fail. It means the maintenance team gets a sharper signal and more time to inspect, plan a controlled stop, or move work to another line.
The business case
Take a conservative example. A production line costs $150,000 per hour when it stops, including lost output, recovery work, and logistics disruption. If earlier warning prevents one four-hour unplanned outage per quarter, the avoided cost is about $2.4 million a year. That is not a promised outcome. It is the kind of calculation leaders should make with their own numbers.
The same model can help in other places:
| Decision | What the forecast uses | Potential value |
|---|---|---|
| Predict equipment stress | Sensor history, planned load, maintenance calendar | Fewer unplanned stops |
| Plan spare parts | Failure signals, supplier lead times, maintenance schedules | Less downtime without bloated stock |
| Balance production | Orders, backlog, shift patterns, capacity, holidays | Fewer late deliveries and less overtime |
| Manage energy | Production plans, tariffs, weather, power use | Lower peak-demand charges |
There is a second value proposition here that often gets missed: working capital.
If a manufacturer carries $50 million in spare parts and work-in-progress inventory, an 8% reduction in safety stock releases $4 million. The goal is not to starve the plant of inventory. The goal is to hold the right inventory because the company has a more credible view of demand, lead times, and production risk.
That is a CFO conversation, not an IT experiment.
Banking: make better calls before the daily cut-off
Banks run on forecasts, whether they call them that or not.
How much cash will leave today? How much liquidity should be held overnight? Which servicing teams need more staff next week? Where will ATM demand spike over a holiday? Which business customers may face payment stress in the next quarter?
The challenge is that banking data is deeply connected. Calendar events, payroll cycles, billing runs, interest-rate changes, seasonality, merchant activity, and customer behavior all matter.
TimesFM-3 LLM offers a better fit for these linked signals than a series of disconnected models.
Picture a commercial bank forecasting cash demand across branches and ATMs. It has historical withdrawal data, but it also knows future public holidays, local events, payroll dates, branch closures, and seasonal travel patterns.
Instead of asking, “What did this ATM do last Tuesday?” the bank can ask, “What is likely to happen across this region given what we already know about next week?”
That changes the operating decision.
The business case
Imagine a bank operates 2,000 ATMs and keeps an average of $10,000 too much cash in each machine to avoid stockouts.
That is $20 million sitting idle.
A better forecast will not remove all of that buffer. It should not. But if it safely reduces excess cash by 15%, the bank frees up roughly $3 million while still protecting customer service. It also reduces emergency cash transports and the operational risk that comes with them.
The same pattern applies to treasury.
A bank can combine past payment flows with future-known events such as payroll runs, bond coupon dates, tax dates, holidays, and planned corporate disbursements. The result is a clearer view of likely intraday and overnight cash positions.
That gives treasury teams more time to decide whether to borrow, invest, reposition liquidity, or preserve a buffer.
For credit and collections, the model can forecast volumes and risk signals across a portfolio. But leaders should draw a bright line here: a forecasting model should support human decisions and governed risk processes. It should not become an opaque machine that makes lending decisions without proper controls, testing, explainability, and fairness reviews.
Banking’s value proposition is not “replace judgment with AI.”
It is this: give experienced people a better view of what may happen next, while keeping the accountability where it belongs.
How TimesFM-3 Works Under the Hood
TimesFM-3 is not a language model that happens to read spreadsheets. It is a 330-million-parameter, decoder-only transformer trained specifically on time-series data—more than one trillion real and synthetic time points, according to Google.
Its key advantage is multivariate forecasting. Rather than forecasting one signal in isolation, it can process a grid of related signals across time.
A factory might feed it machine temperature, vibration, power draw, production rate, scrap rate, shift plans, and scheduled maintenance. A bank might use cash flows, payment volumes, payroll dates, holidays, interest-rate resets, and branch activity.
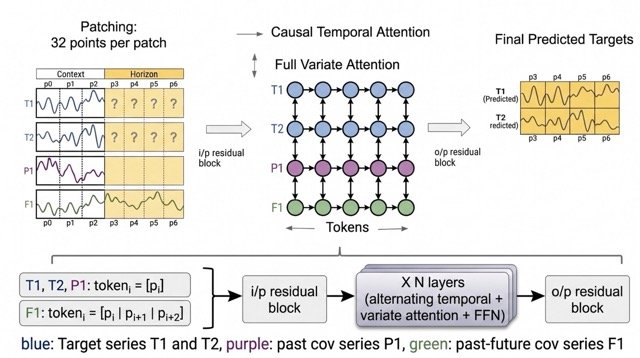
The model first groups each series into patches of 32 time steps. It normalizes each series independently, which prevents a large-scale signal such as transaction value from drowning out a smaller one such as a vibration reading. Each patch becomes a token.
Then comes the important part: alternating attention.
First, causal temporal attention lets a token attend only to earlier patches in the same series. This preserves the forecasting rule that the model cannot see an unknown future target value.
Next, full variate attention lets the model attend to other related series at the same point in time. That is how it can learn, for example, that higher machine load and rising temperature often precede a quality issue, or, in banking, that payroll dates and public holidays shape cash demand.
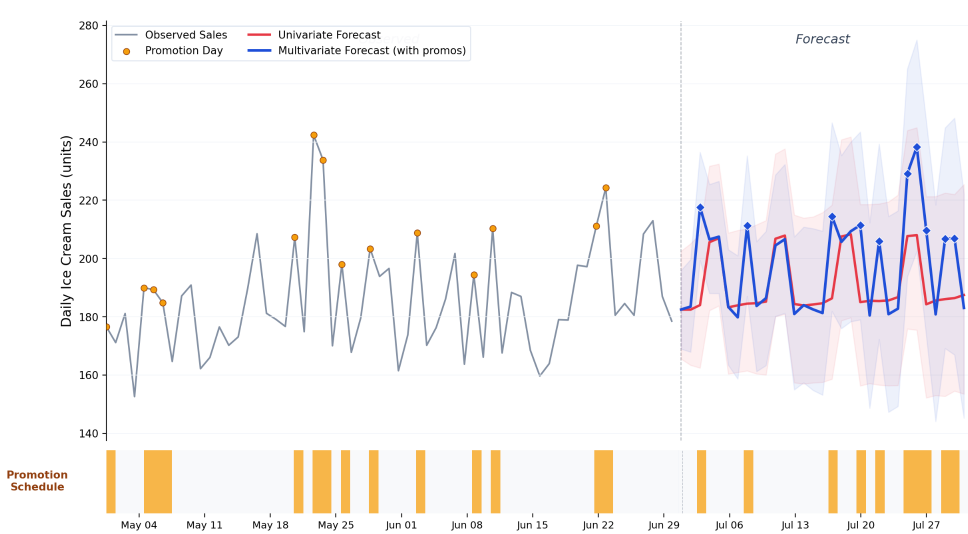
Known future inputs receive special treatment. If the company already knows next week’s production plan, planned maintenance, holiday calendar, or promotional schedule, TimesFM-3 can expose those signals to the model during the forecast horizon. It does not need to guess them.
Unlike many autoregressive forecasting models, TimesFM-3 does not generate one future patch, feed it back in, and repeat. It appends masked placeholder tokens for the full forecast horizon and predicts the entire horizon in one forward pass. This reduces latency and avoids part of the error accumulation that comes from repeatedly forecasting a forecast.
The output is probabilistic. For each target and future time step, the model produces nine quantiles—from the 10th to the 90th percentile.
A decision maker can therefore ask more useful questions than “What is the forecast?” They can ask: “What is the downside case?”, “How wide is the uncertainty range?”, and “At what confidence level should we intervene?”
Zero-shot does not mean zero work. The model still needs clean, time-aligned historical data, valid future covariates, and back-testing against the company’s current forecasting method. In banking, it also needs model-risk controls, lineage, monitoring, and human accountability. In manufacturing, it needs a clear operating response when the forecast signals elevated risk.
The architecture is powerful because it learns both time and relationships. That is the difference between predicting what one metric did before and predicting what a connected business system is likely to do next.
TimesFM-3 is promising for evaluation and prototyping, but Google currently licenses its pretrained 3.0 weights for non-commercial, non-production use. Enterprise leaders should treat it as a benchmark candidate until a production-use license and support model are available.
Links:
– Google’s technical overview of TimesFM-3
– Github repository